Why you should care about volatility
Volatility isn't just for day traders; it can help any investor improve returns.
Dr. Richard Smith
December 23rd, 2022
Blog | Why you should care about volatility
tl;dr
More-volatile portfolios earn less in the long run than low-volatility ones
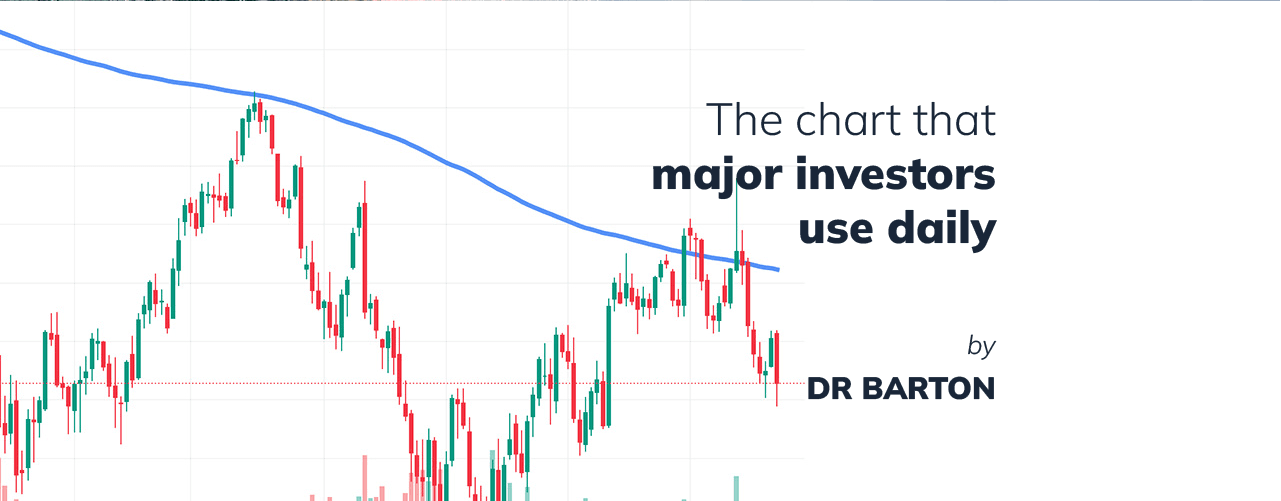
Institutions look at risk- and volatility-centric metrics every day
Use Finiac to design a low-volatility portfolio, even if you want to be in riskier assets
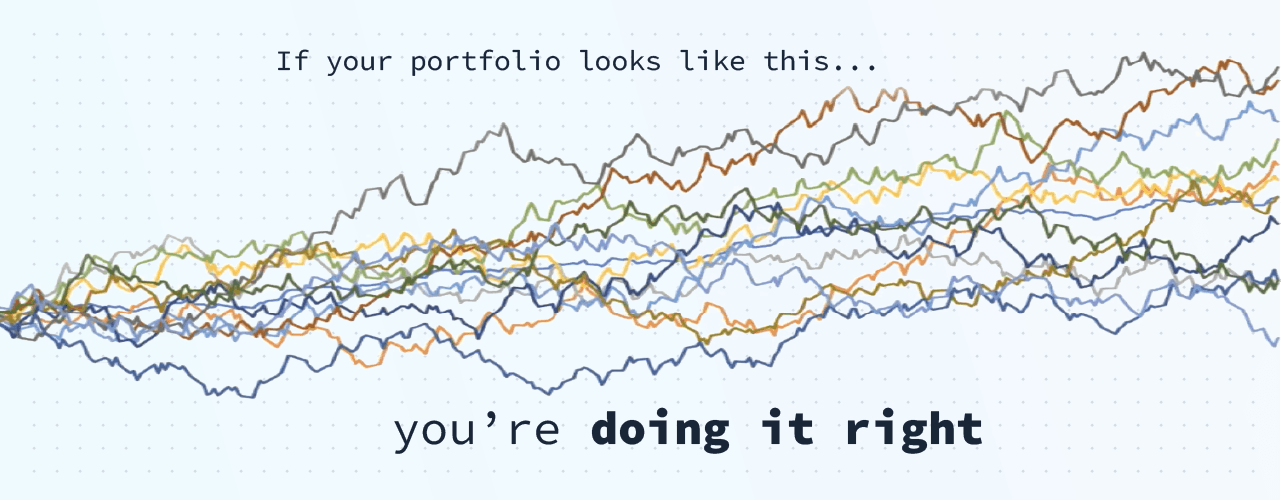
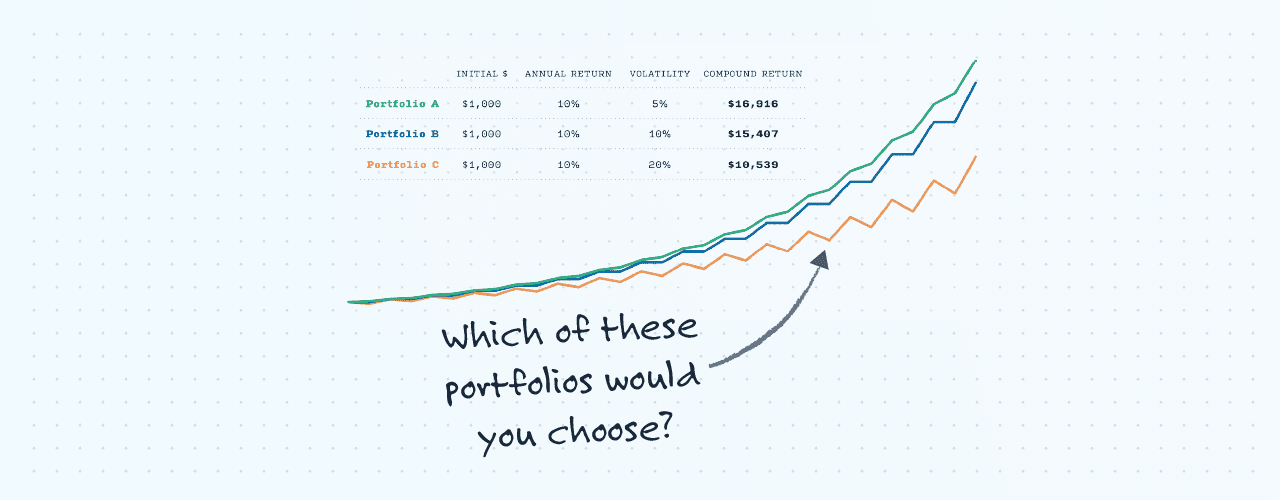
This is a pretty incredible chart I’ve been looking at recently.
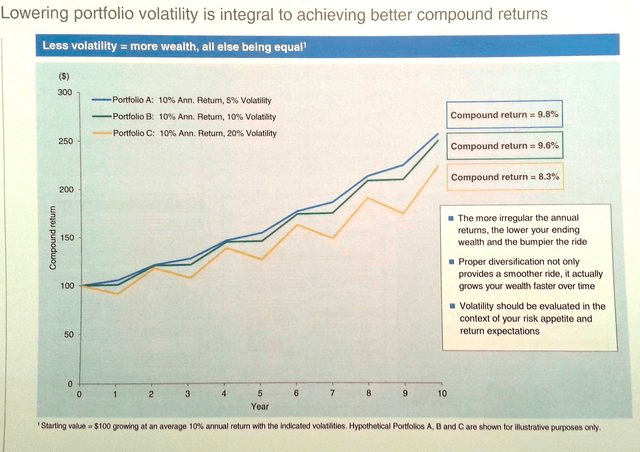
These are three different portfolios, showing ten years of performance each, and they all have the same annualized return of 10%.
But they all have a different compound return over the ten years. So they each made 10% a year, but the compound return at the end of ten years was:
9.8% (blue line)
9.6% (green line)
8.3% (yellow line)
What's the difference between these three? How do you get the same return but a different compound return?
It's the volatility.
If you have a comparable annual gain with less volatility, you get a higher compound return.
The blue line made its 10% with only 5% volatility—and it kept most of that, compounding to 9.8% overall.
The green line took on 10% volatility, and you can see that the ultimate return started to drop, to 9.6%.
The yellow line doubles the volatility again, to 20%, and you really see the impact—the final return was only 8.3%.
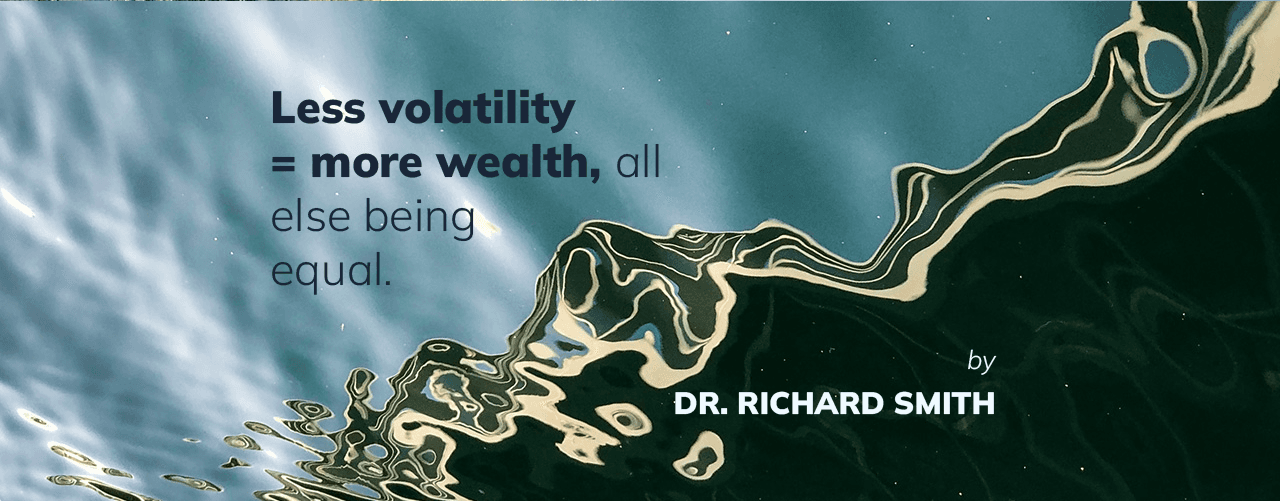
Less volatility equals more wealth, all else being equal.
My contention about the markets is that most of retail finance is about seducing us to take on more volatility than we need to take on. And then the Citadel Securities and the market makers of the world essentially skim off of that excess volatility, which is reducing our returns and taking our return and putting them into their pockets.
This is one of the major reasons we built Finiac: to help independent investor reduce their volatility.
Finiac is all about reducing volatility
Historically, this stuff hasn’t been easy. Institutions look at risk- and volatility-centric metrics all day long. But the tools just aren’t out there for individuals.
So that’s where we decided to start.
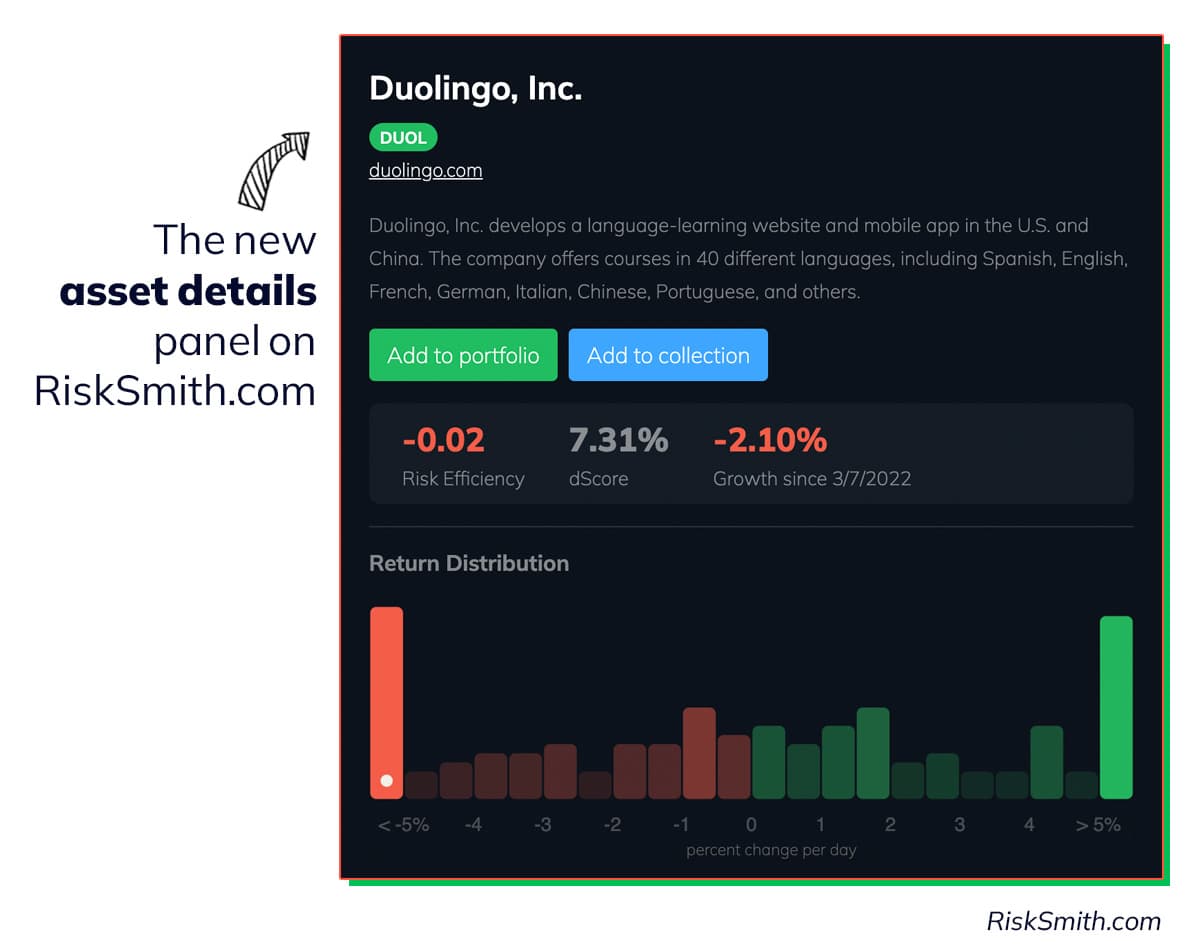
Let’s take a look at the asset detail pages—these are actually outside of the paywall. Every ticker in equities and crypto are here for the browsing.
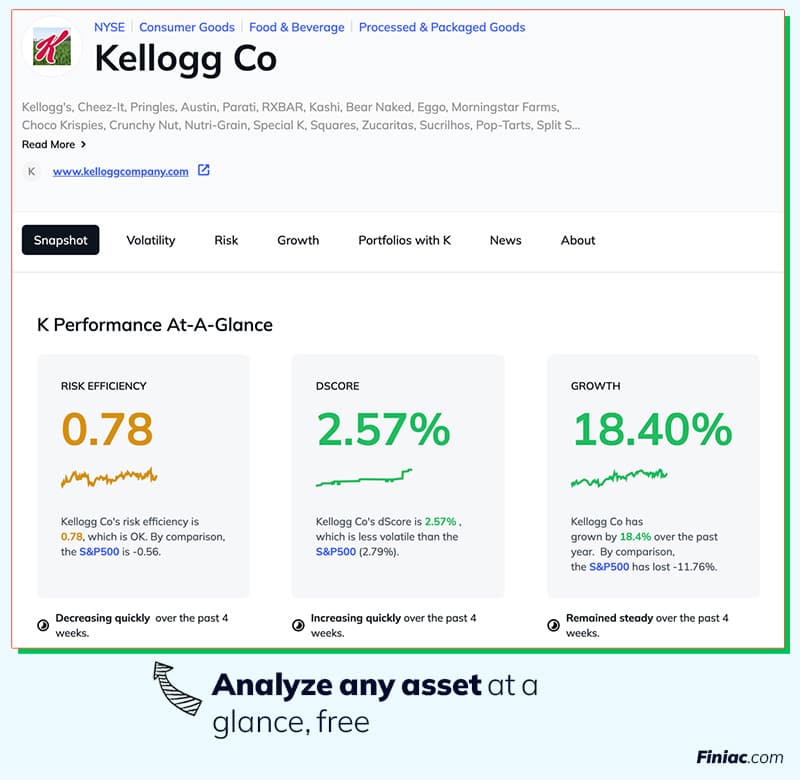
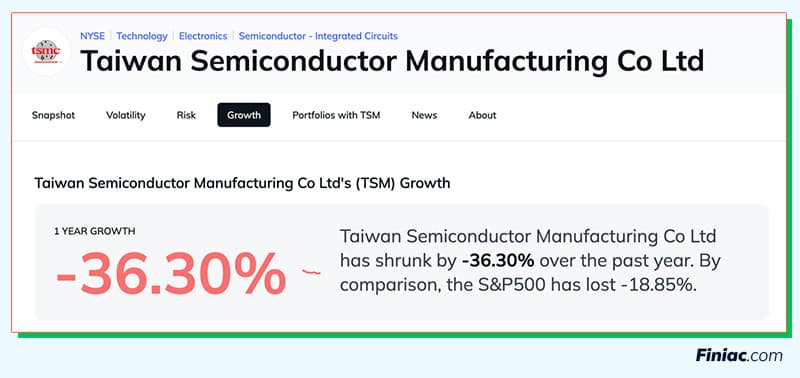
Just as an example, I was recently looking at Taiwan Semiconductor. You can see right off the bat that the growth has not been great—but then again, that’s true of most of the market, so it doesn’t really tell us much.
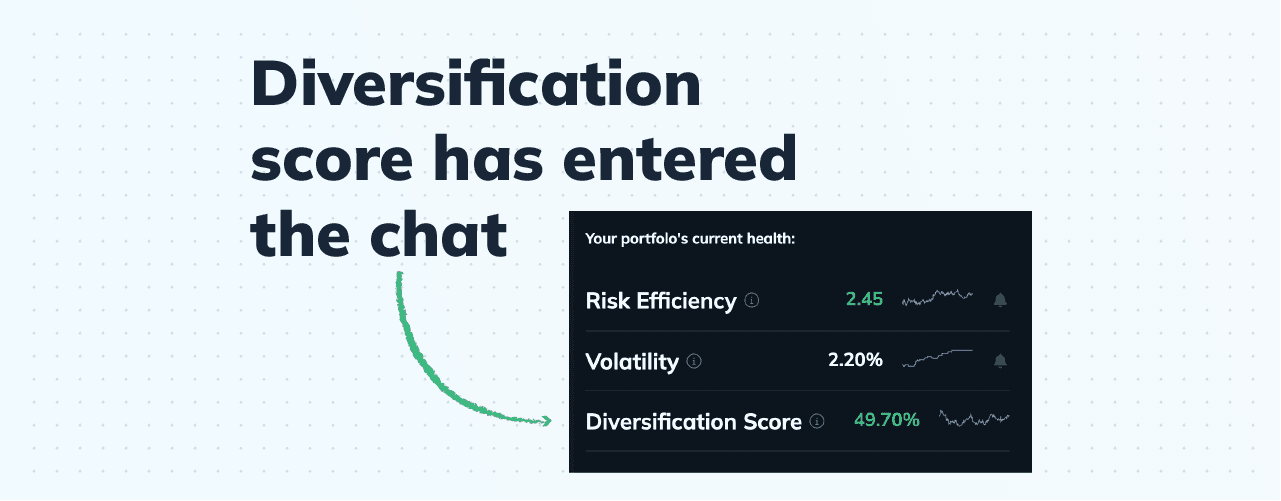
So we go one step further: volatility. Essentially, that’s what the dScore is.
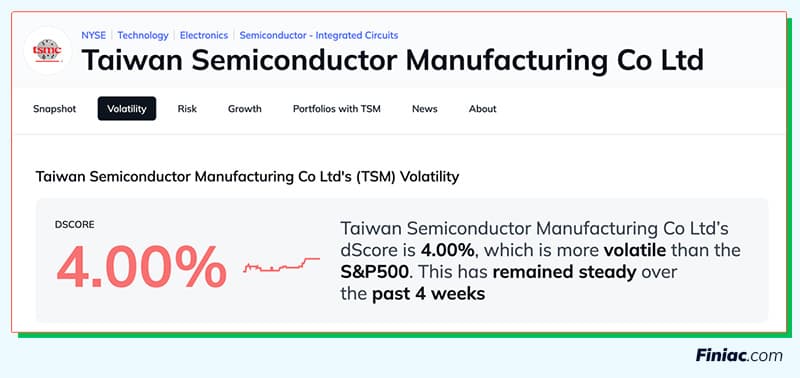
Its dScore, as I write this, is 4.00%. That's telling you that, once a month, you should expect a bad day of around 4%. Or a good day! You know, that's just volatility, actually. It goes up or down.
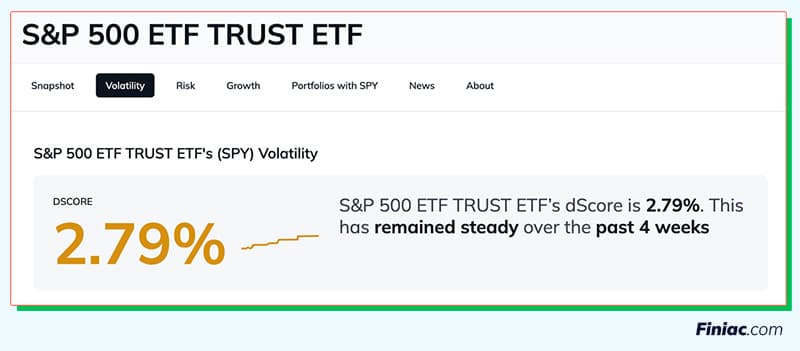
To compare, let’s pull up SPY (an S&P500 ETF). The dScore is 2.79%. So the expectation for your worst day each month is a little easier to handle. TSM is a lot more volatile than the S&P500.
Volatility isn’t just for traders
When I’ve shown this around to folks, sometimes I hear:
Why would I care about my worst day once a month? I hold positions long term. I don’t even look at my portfolio every day.
This goes right back to where we started, with compound interest.
Even if you’re rolling with the punches and holding right through the dips, higher volatility has a huge impact on your long-term return.
Let’s say you’re aiming to match or even slightly beat the market. Most of us use the S&P500 as a benchmark, which tends to return 7-8% per year on average.
If that’s your mark, you need to look beyond just the return. You need to match that 2.5-3% volatility, as well. Because even if you’re matching the average return of the market, your ultimate gain goes down the higher your volatility.
Or, think of it this way:
You can aim to build a portfolio that matches the market’s returns, but with even lower volatility. In that case, your compound return climbs even higher.
Don’t take on unnecessary volatility
Without knowing about volatility, you’re flying blind, to a certain degree. If you had everything in Taiwan Semiconductor, with its 4% dScore, then you're taking on unnecessary volatility. You're lowering your compound annual returns.
Say your portfolio's dScore is 2.64%, which puts it just about in line with the S&P 500.
Let’s say you believe in TSM, and want to add it. Despite the fact that its Risk Efficiency isn’t doing too well right now. It’s got a lot of volatility, and growth is going down.
But now that you're tracking volatility at the portfolio level as well, you can choose to dive into something like TSM. You just have to make sure you're balancing it with less-risky assets so that the volatility of the overall portfolio remains at safe levels.
This is how to build portfolios without taking on unnecessary volatility, and not giving away your compound return to.
This is the piece that nobody really has access to right now. It’s why we had to design it. And this is why we focus on volatility so much in terms of building a smart portfolio.
We're very proud to be able to bring this level of sophistication down to individual, self-directed investors and traders.
These tools are used by professionals, institutions, banks every day. We want to get them into the hands of the public in a way that they can be understood and put to work immediately.
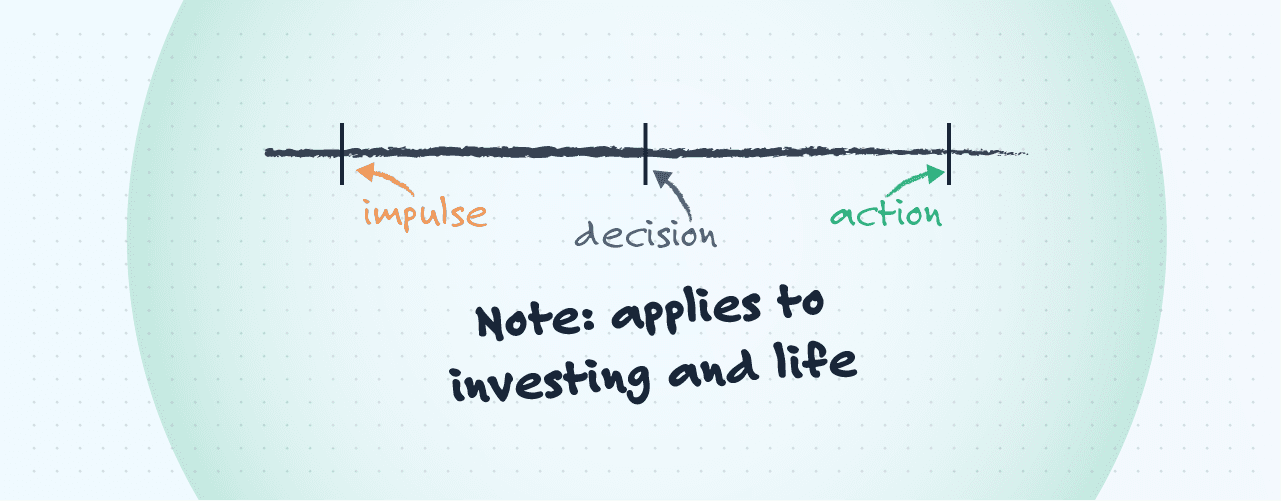
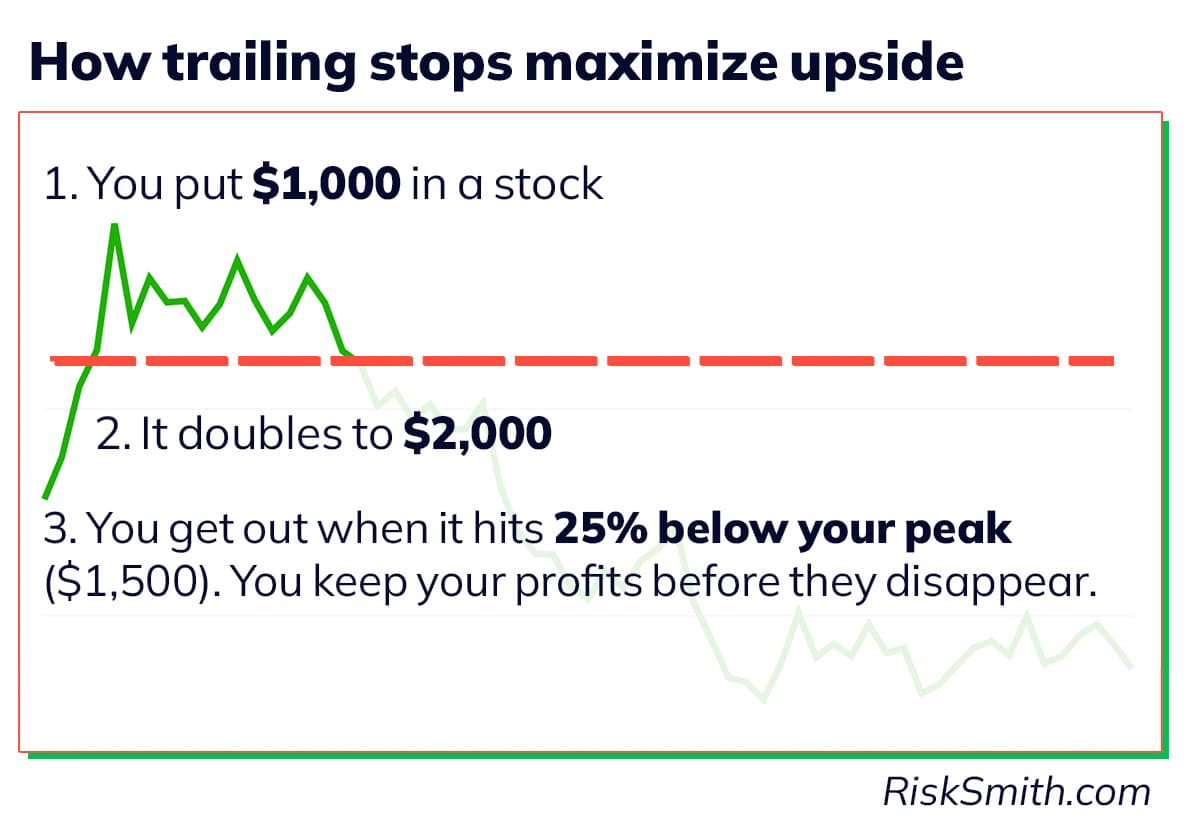
Don't fall prey to loss aversion
Design better portfolios with RiskSmith

Risk Efficiency - A metric that tells you how well an asset is trading risk for reward. The number is closely related to the Sortino Ratio. Risk Efficiency can be calculated for any asset—a stock, an ETF, a portfolio, and more.
dScore - A metric describing the amount you can expect to lose on an investment on your worst day in an average month. Equal to an asset’s 95% value-at-risk.
Other posts that mention terms Risk Efficiency dScore

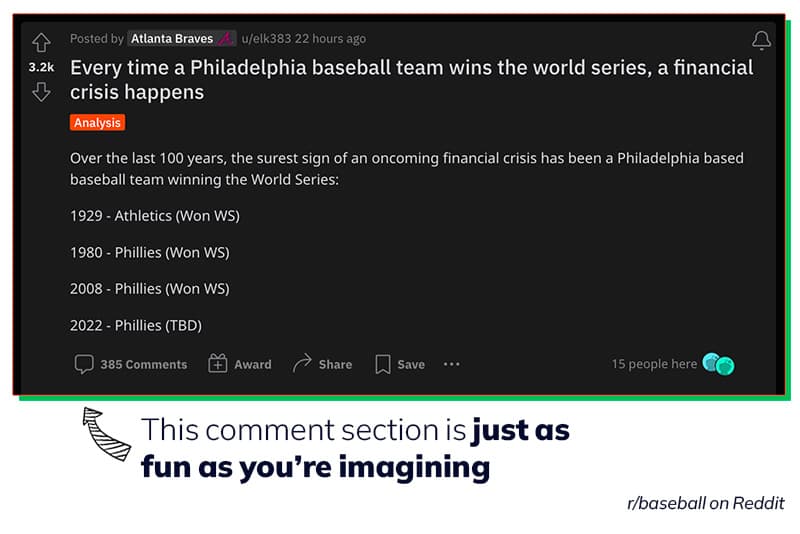
Analyzing a Portfolio from Reddit
Dr. Richard Smith

5 Questions to Ask Before Buying a Stock
Justin Davis
We built a better way to research assets
Dan Muse
We built a better way to research assets
Dan Muse
Related Posts