The Santa Claus Rally (and why it didn't work this year)
Too much volatility = a stocking full of coal.
D.R. Barton
January 5th, 2023

Blog | The Santa Claus Rally (and why it didn't work this year)
tl;dr
The Santa Claus Rally typically occurs in the last 5 trading days of a year, and the first two of the next
It didn't pan out in 2023. The window closed yesterday and we're flat
Excessive volatility in the markets can throw a wrench in otherwise reliable patterns like the Santa Claus Rally
The Santa Claus rally — traditionally, anyway — stretches across the last five trading days of a calendar year, and into the first two of the next.
It’s a reliable cycle (more on that below), but this year? We’re looking at a stocking full of coal.
We wrapped that period yesterday, and the rally, unfortunately, looks just as mythical as the big guy:
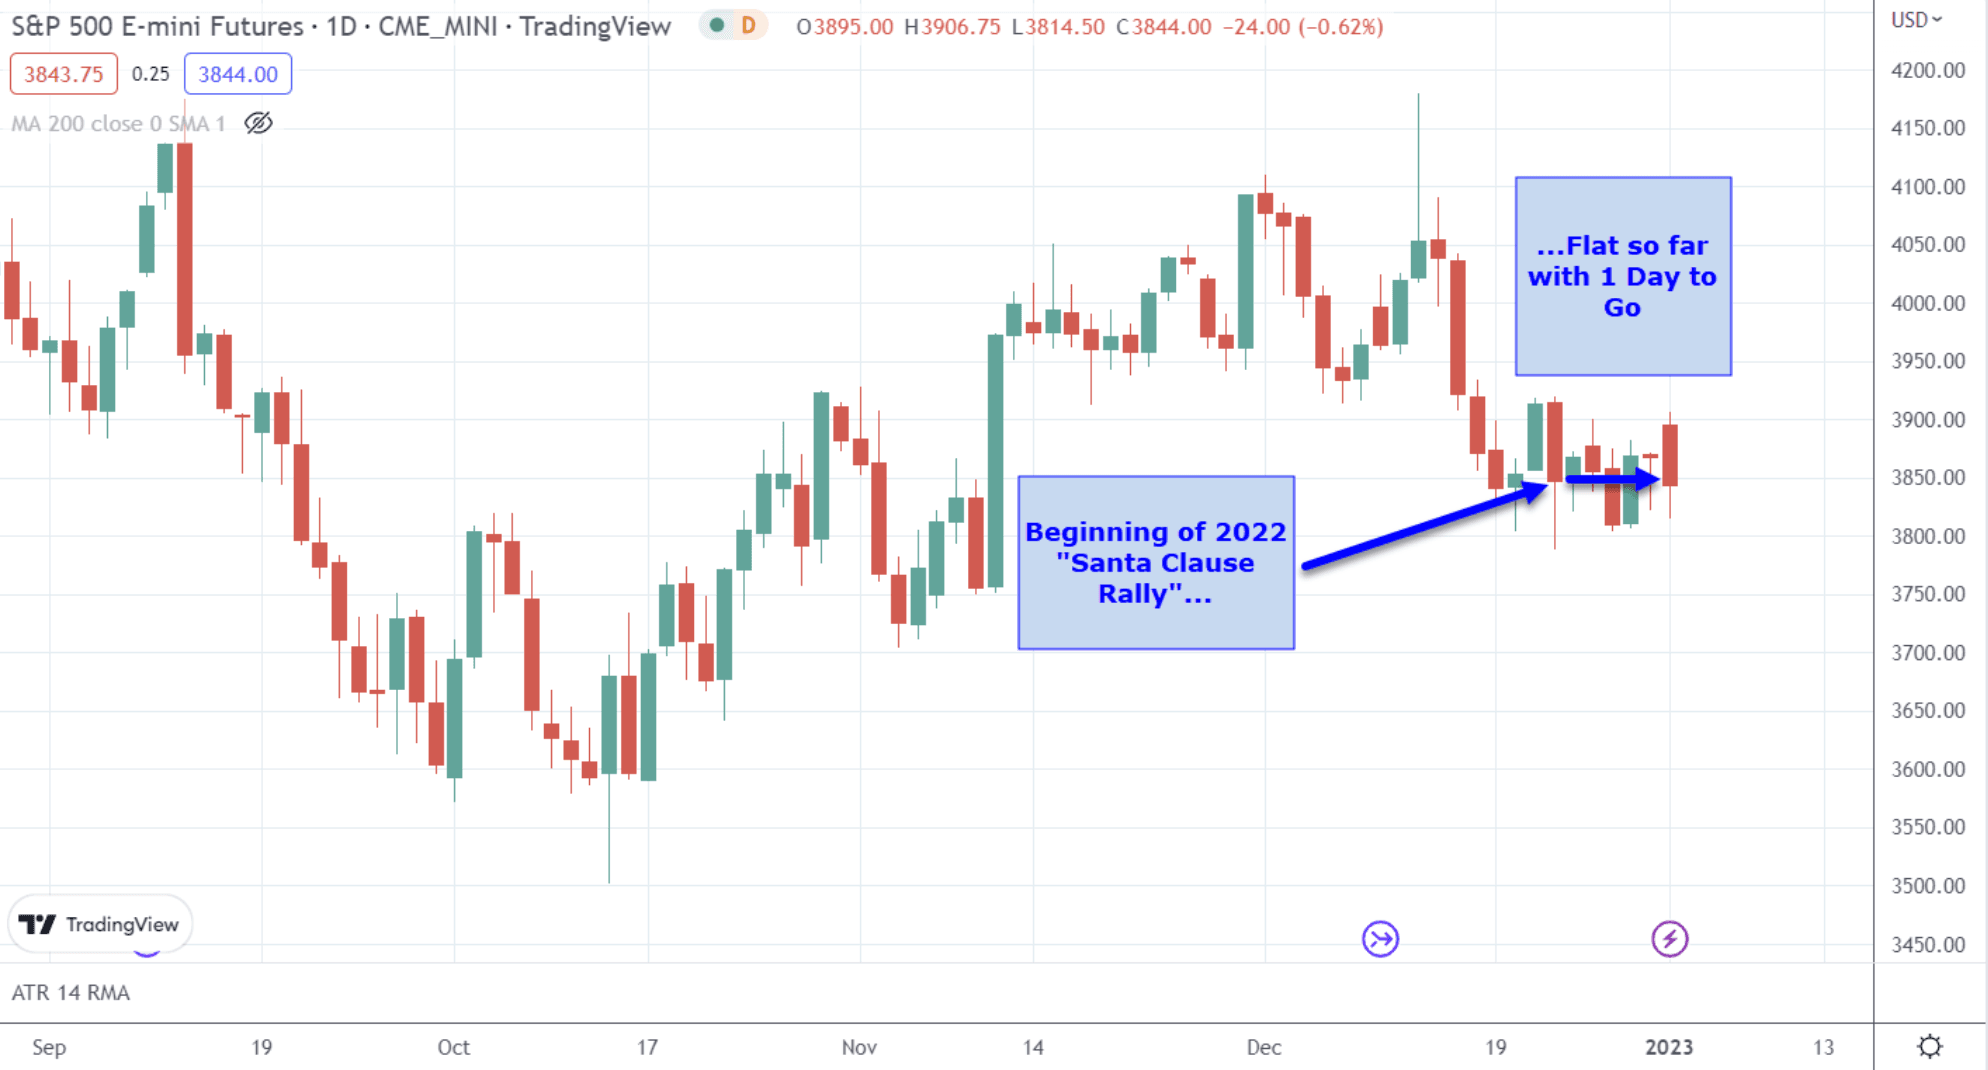
The Santa Claus Rally (that wasn't) of 2023
Probably a fitting close to a rocky year.
Let’s look at how we got here.
Markets in 2022 were rocky
If we had to choose a theme for 2022, now that it’s in the rear-view, I’d nominate “uncertainty.” Everywhere you look, things were on shaky ground.
In the U.S. markets, that made for one of the most volatile years ever (more on that below). After decades of low inflation, a “perfect storm” sent us up to the highest inflation levels in 40 years:
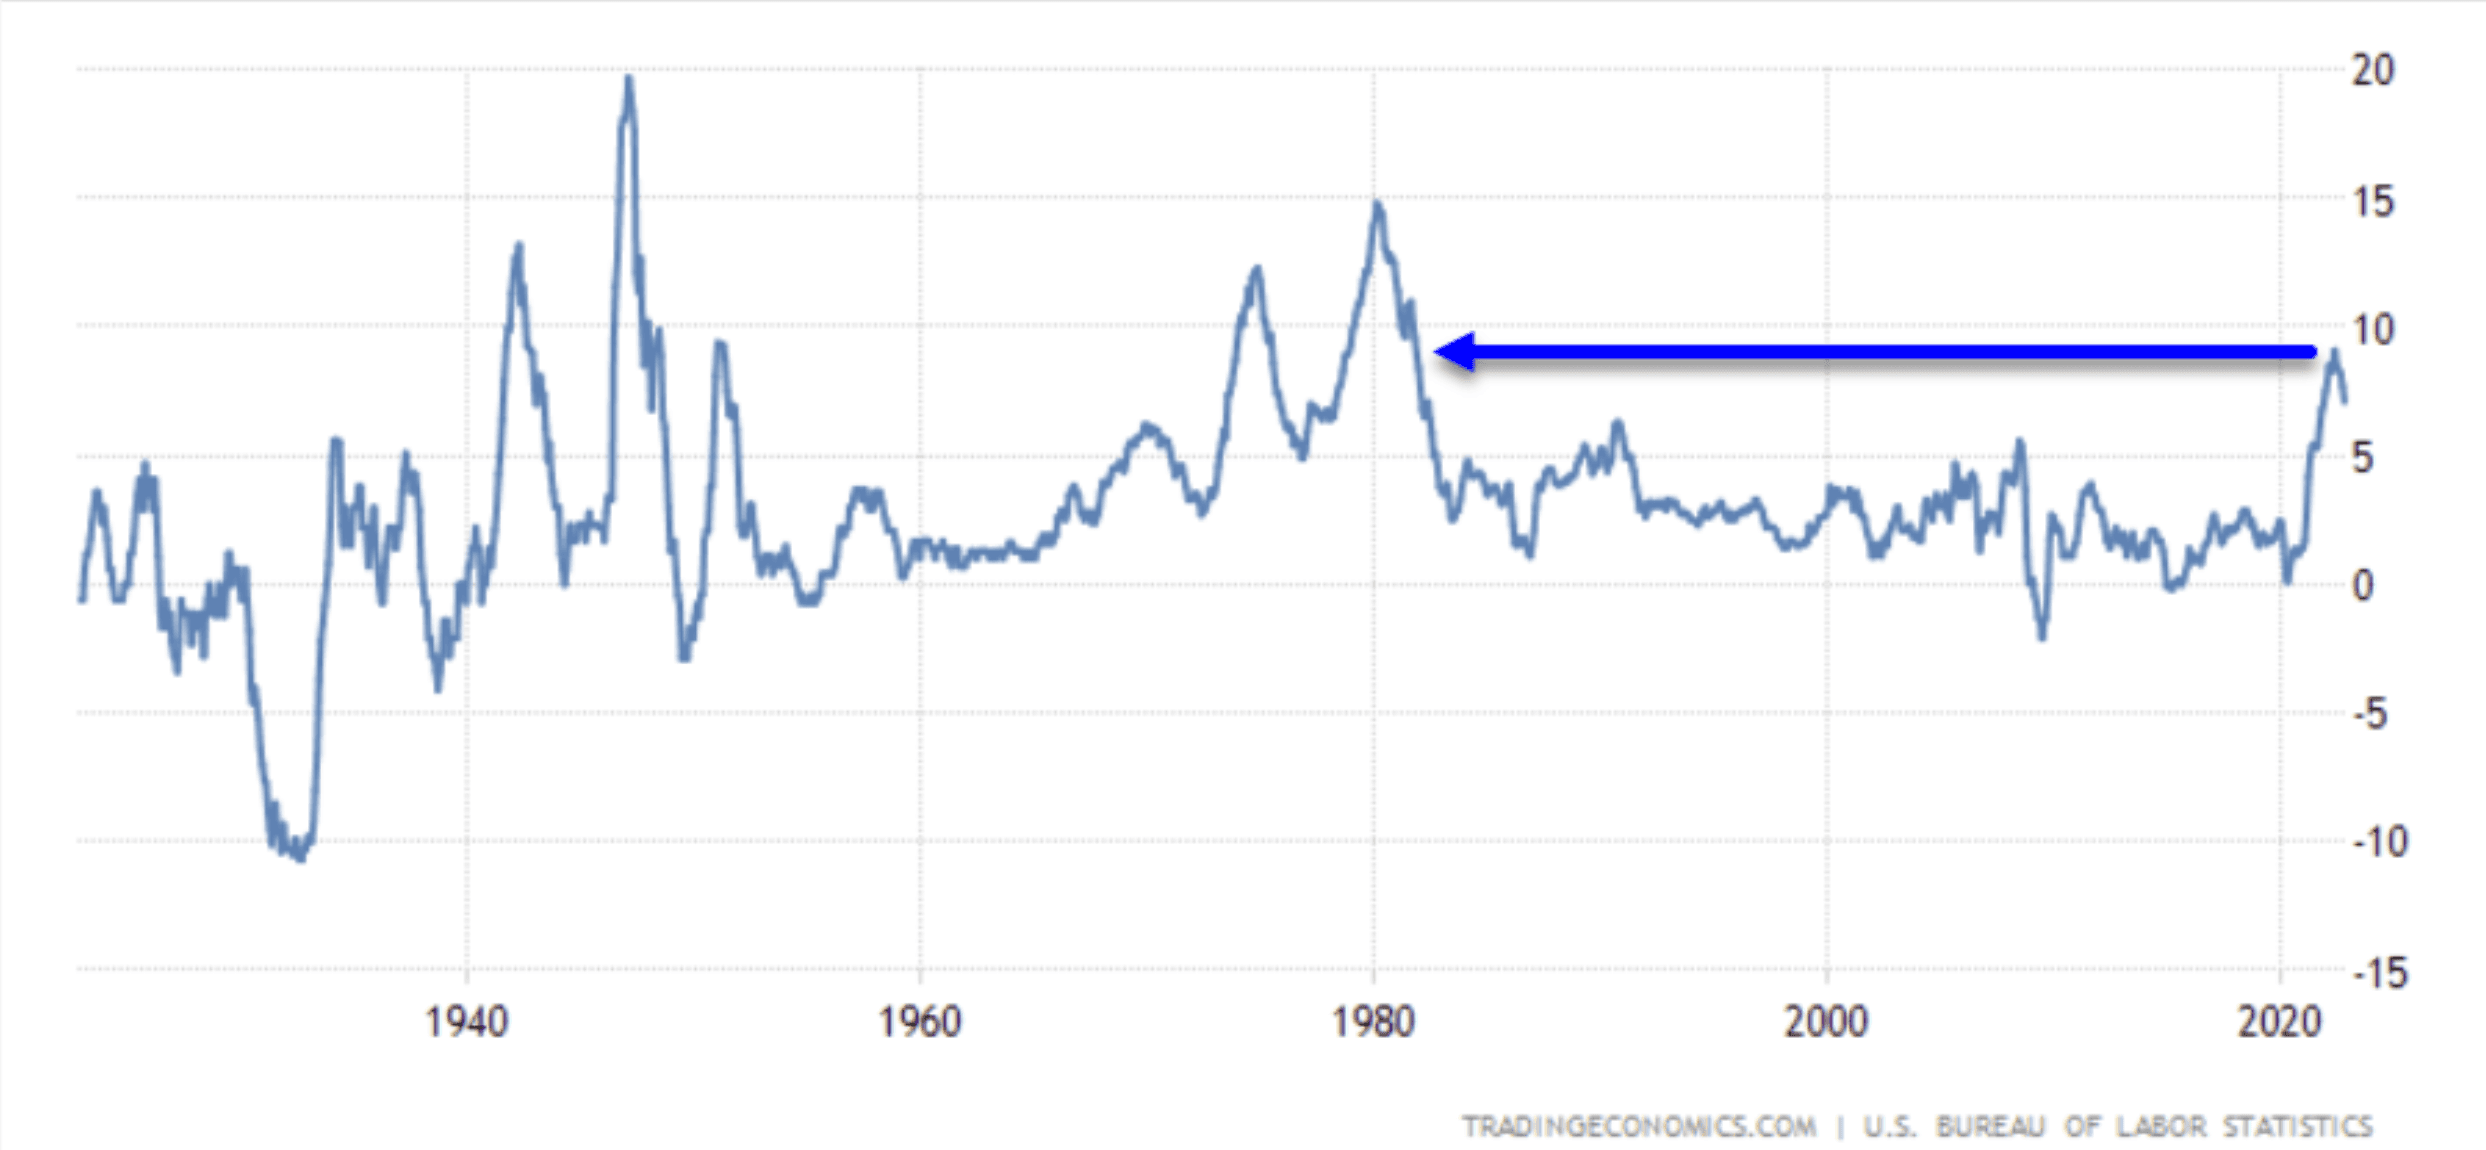
Inflation levels over the last 40 years.
That perfect storm combined three forces:
Massive amounts of Covid-related monetary stimulus from central banks around the world brought unprecedented amounts of excess cash into the global economy
The first land war in Europe since WWII has impacted major energy and agricultural producers
Supply chain disruptions from two or more years of pandemic restrictions
Even my fourth-grade economics students could understand what was going on:
Much more cash chasing fewer available goods and services and voila — inflation.
Markets hate inflation. How much? So much that there were 63 individual days in which the S&P 500 dropped by -1% or more. By that metric, it’ the fourth-most-volatile year since 1928! Only 1974, 2002, and 2008 had more days that fell -1% or more.
A market this volatile puts a huge premium on risk management. It seems even Santa is having trouble bailing out stocks this year.
The “Santa Claus Rally,” Defined
Let’s clarify what we mean by “Santa Claus Rally.” Some use the term to refer to the period leading up to Christmas. But the most common meaning—and the one I’m using—looks at market performance over a seven-day trading period: the last 5 trading days of the current trading year and the first two trading days of the New Year.
Through the years, the indicator has given rise to a Wall Street aphorism:
“If Santa Claus should fail to call,
Bears may come to Broad & Wall”
—Old Wall Street Saying, attributed to Yale Hirsch
Does the Santa Claus Rally work as an indicator?
In their well-known Stock Trader’s Almanac, Hirsch and Hirsch explored if end of year trading has a directional tendency and they proposed the Santa Claus indicator.
Since 1969, this seven-day period has returned positive results in the S&P 500 in 41 out of 53 years for an impressive 77.4% win rate, and an average return for all years of +1.3%.
Looking back another 20 years shows that the seasonal move holds up with a similar percentage of wins and gains. More impressively, there weren’t any really strong or weak decades, just consistently 7 or 8 winning years out of every 10:
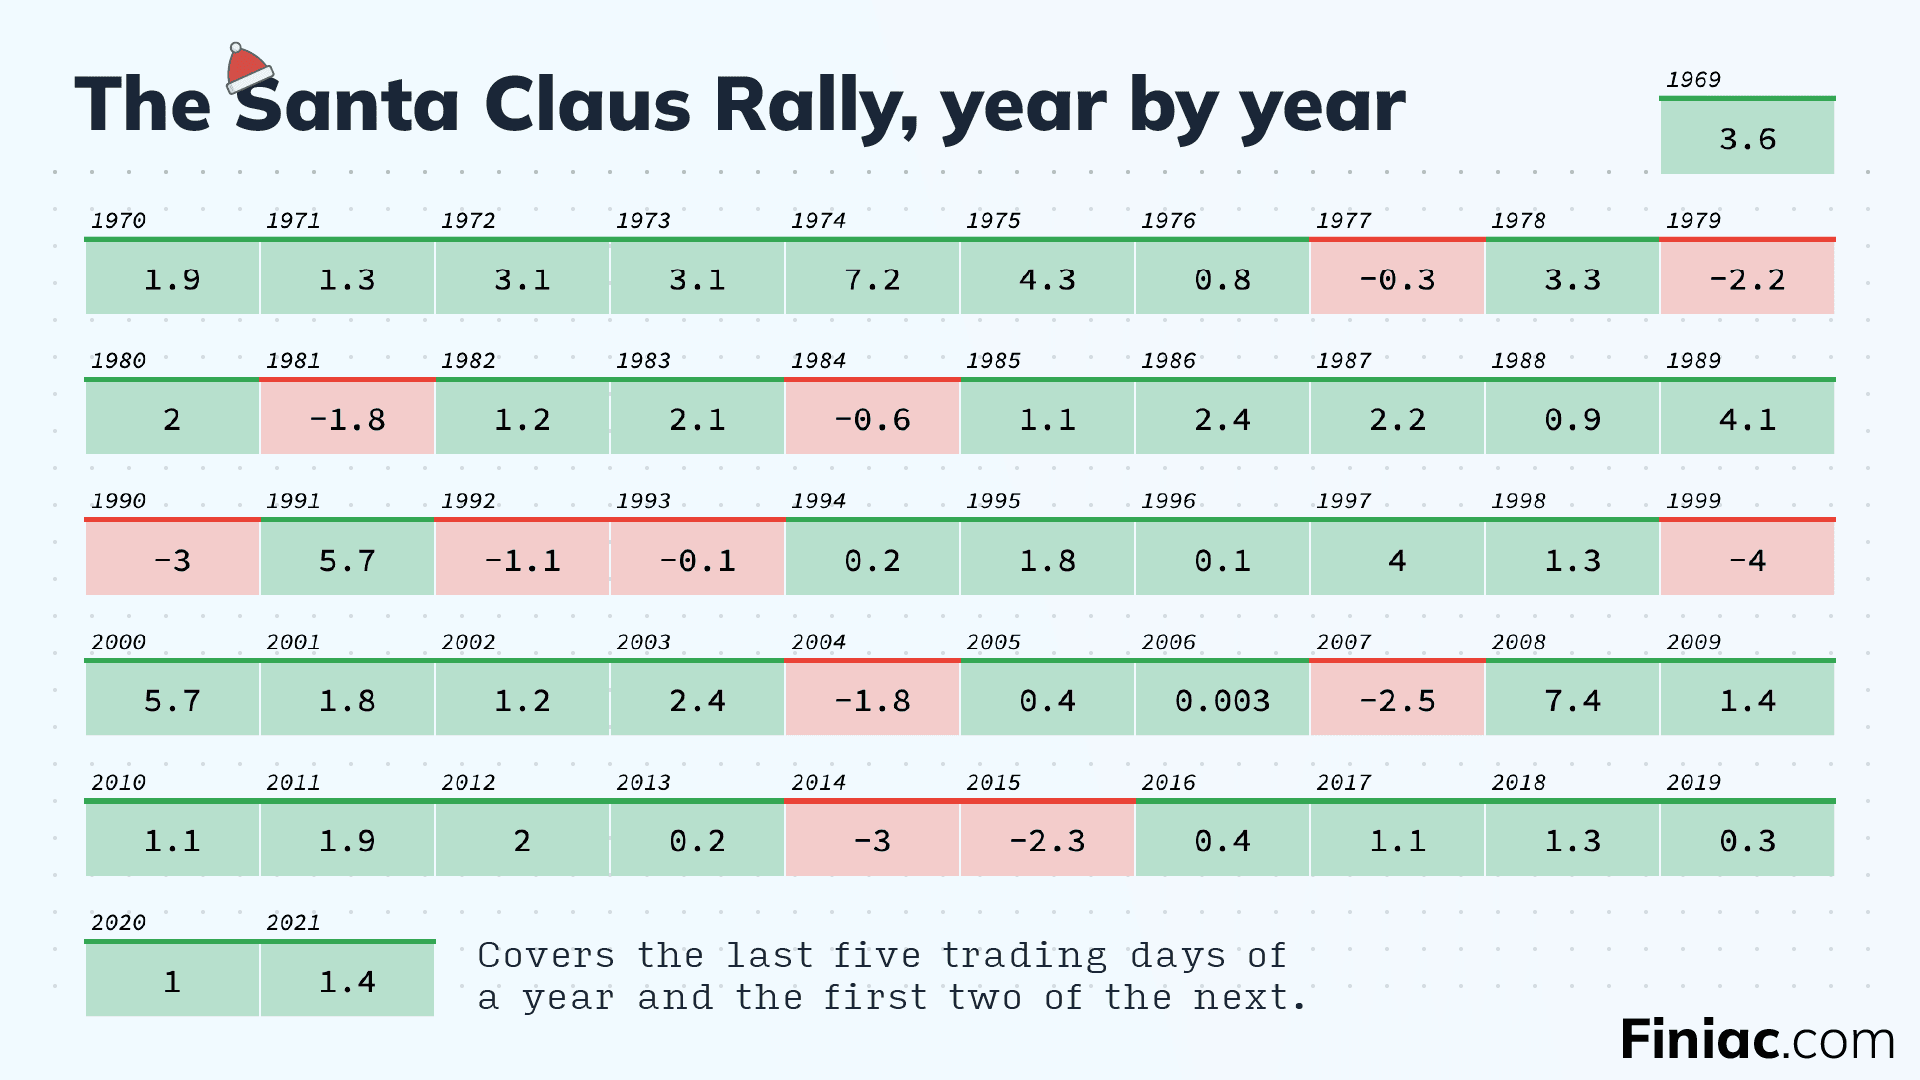
Results of the Santa Claus Rally since 1969.
There are no sure things in the trading and investing world.
But the Santa Clause Rally, with its consistent win rate over the past five decades, thanks to some pretty helpful fundamentals (like fund managers adding winners to their portfolios late in the quarter and new money being put to work in the first couple of days in the new year) add fuel and logic to the consistency of this high-probability seasonal tendency.
So, yeah: the S&P is completely flat this year during that seven-day period.
Seasonal tendencies can help guide us when deciding if we should put new money to work. But as this year has shown, risk management continues to be the most important concept in our toolbox.
Whatever your spiritual tradition, I hope that all the peace, love and joy of this season have been with you and your families! And a very happy New Year to all.
God bless you and great investing,
D.R. Barton
Don't fall prey to loss aversion
Design better portfolios with RiskSmith

Related Posts