Blog | The Presidential Cycle
tl;dr
Market performance varies widely depending on where we are in the 4-year presidential election cycle. Here are the annual returns since 1833:
Year 1: 2.0% (post-election)
Year 2: 4.0% (mid-term)
Year 3: 10.5% (pre-election)
Year 4: 5.8% (election year)
“There are three kinds of lies: lies, damned lies and statistics.” — Mark Twain, misattributing Benjamin Disraeli
The mid-term U.S. congressional election is behind us, but we we still don’t know with certainty who will control the House of Representatives.
By most polls and analysis, the Republicans are favored to win control of the House, but it’s not a lock. Looking at this chart, we can see that from a stock performance perspective, a split congress is not a bad thing:
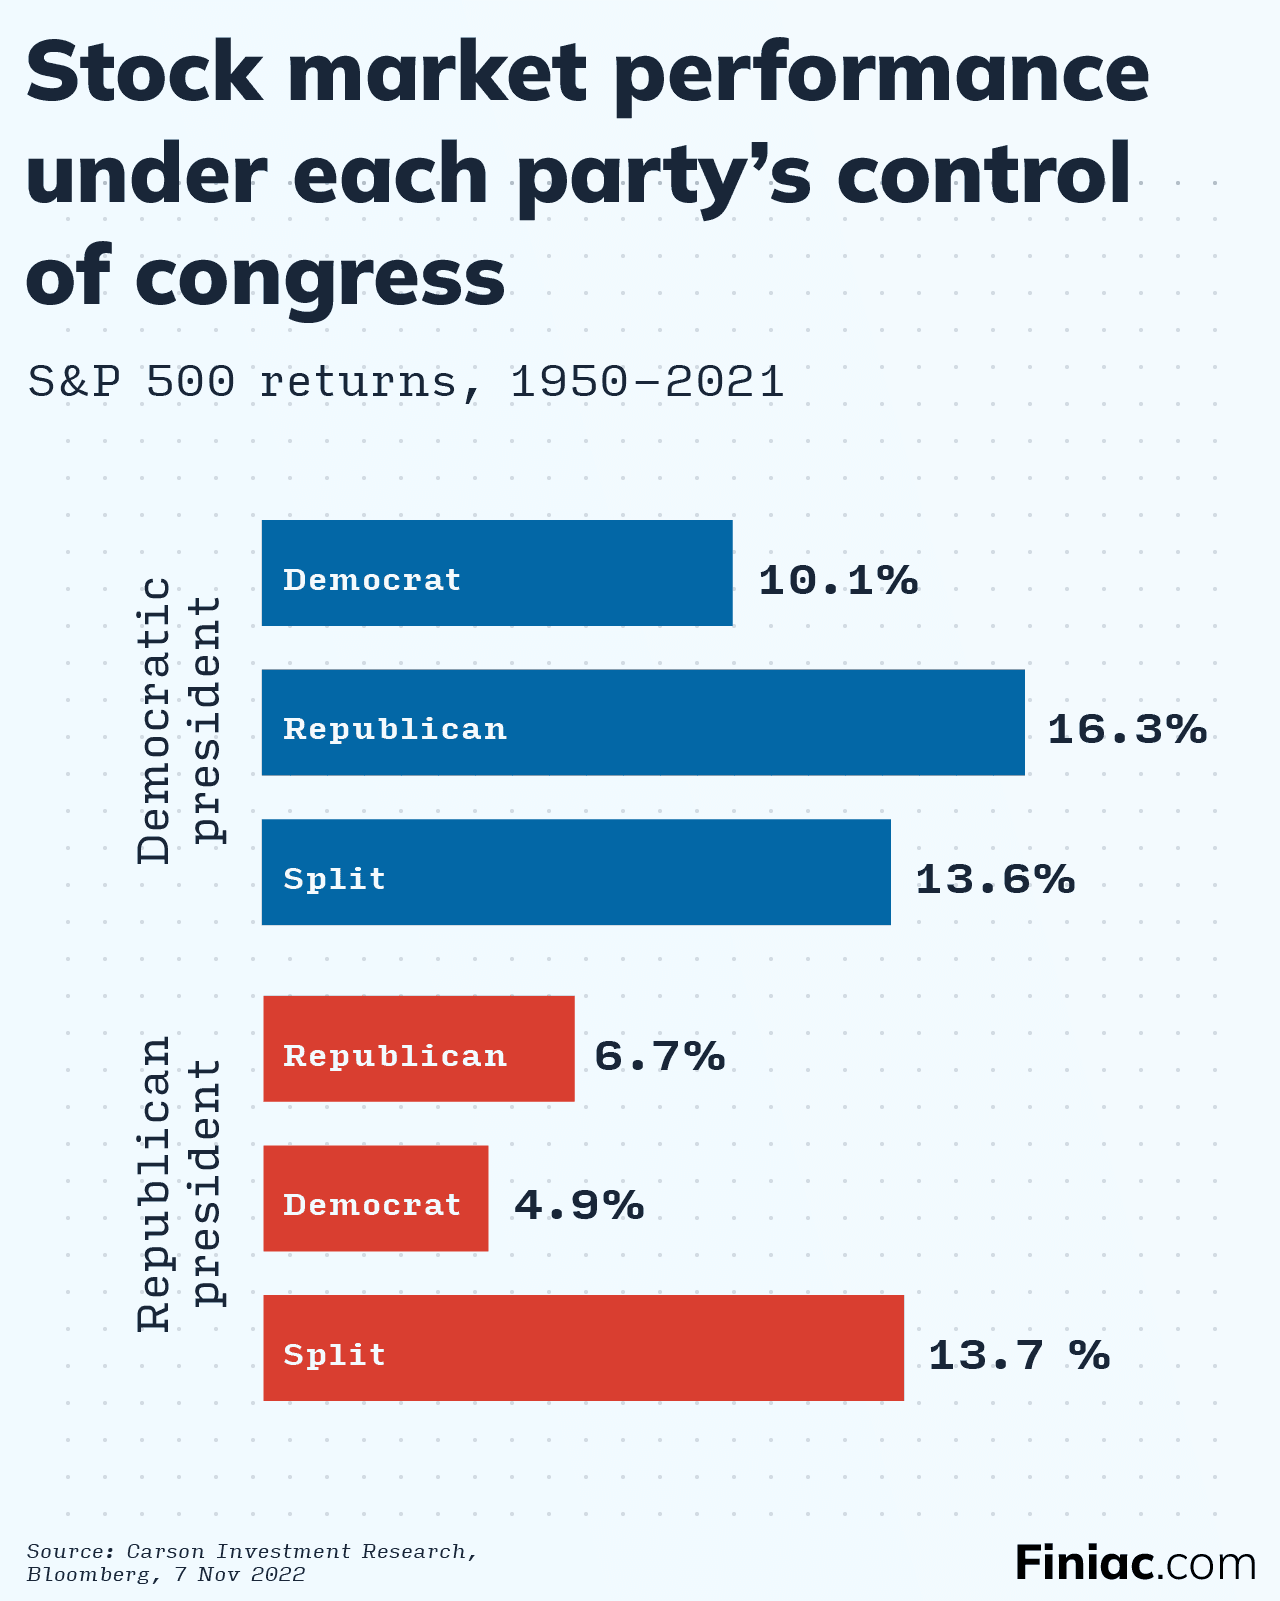
Infographic showing stock market performance broken down by political party of the president in office and the controlling party of congress under that president.
The third bar from the top shows that a split congress with a Democratic president — our most likely scenario for the next two years — has averaged a 13.6% annual, basically tied for the second-best outcome, historically.
We’re now gearing up for the second two years of the four-year presidential election cycle. Today, let’s take a look at this presidential cycle, what the supporters and detractors say about it, and see if we can draw any conclusions.
Presidential Election / Stock Market Cycle — Why All The Fuss?
The presidential election / stock market cycle was popularized (perhaps even originated by) Yale Hirsch in his well-knowin n Stock Trader’s Almanac.
To quote Hirsch:
“Presidential Elections every four years have a profound impact on the economy and the stock market. Wars, recessions and bear markets tend to start or occur in the first half of the term; prosperous times and bull markets in the latter half.”
Hirsch provides Dow Jones data going back the 1833 for each year in the cycle and shows these results:
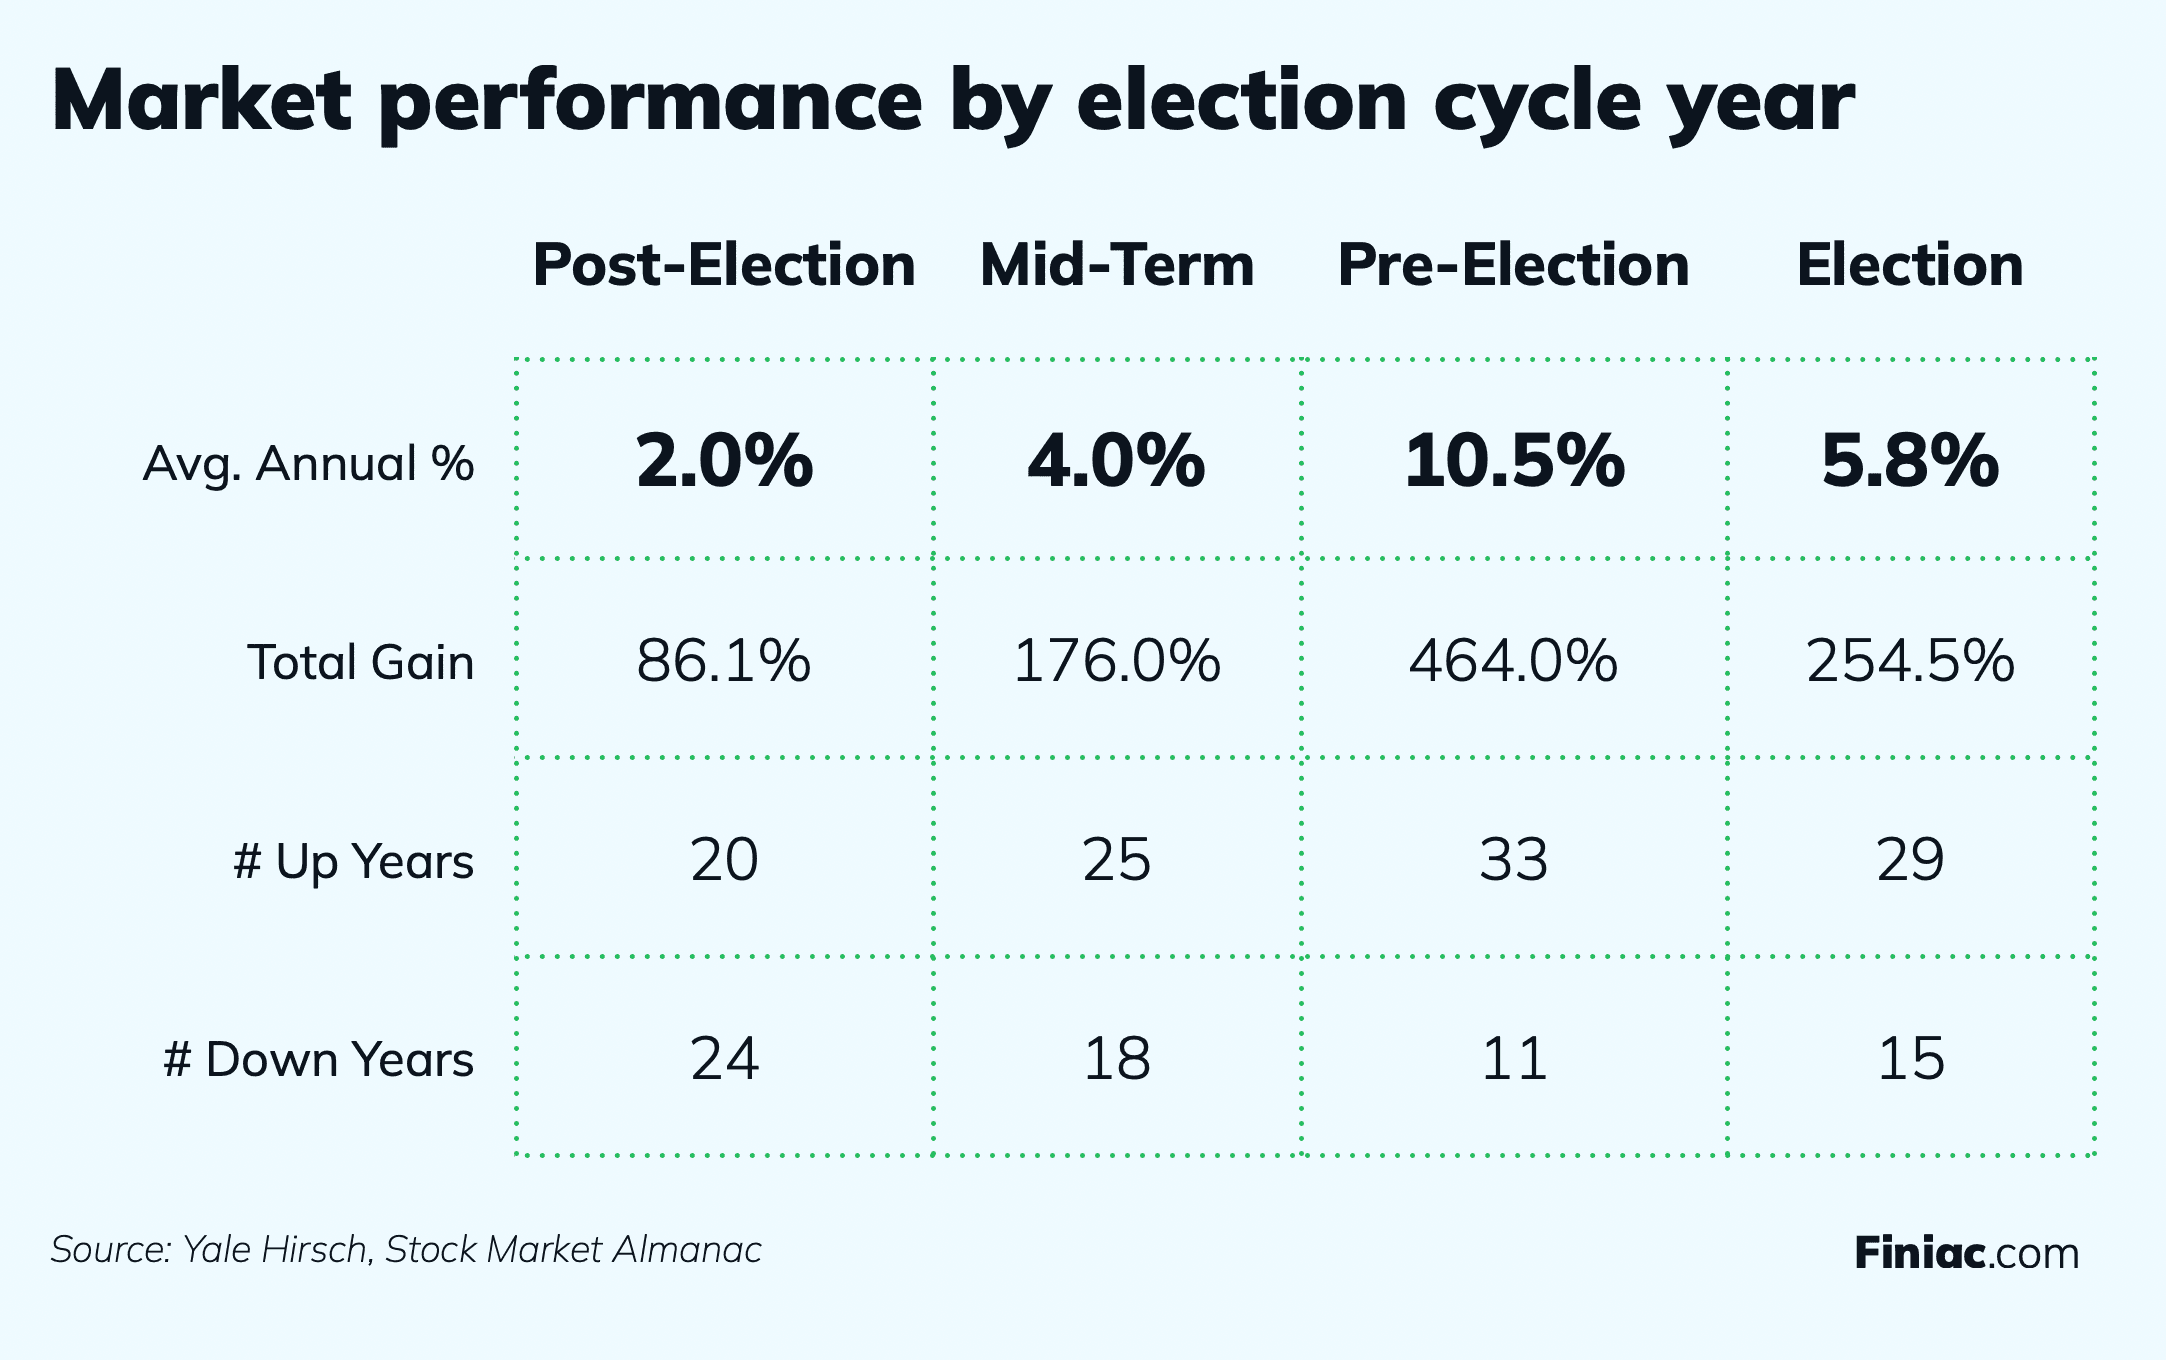
Infographic showing market performance broken down by where we are in the 4-year presidential election cycle.
In short, in statistics-speak, there seems to be a descriptive advantage in the second half of a presidential term, with the pre-election year showing the strongest results and the post-election year vastly underperforming the others.
How Good an Edge is the Presidential Cycle
During national election years (both presidential elections and mid-terms) I always hear new pundits weigh in on the presidential cycle.
One article I read last election cycle was extremely dismissive about the statistical validity of this rather unique seasonal pattern. Since I’m about to blast the author, I’ll not mention a name. But the short version of his argument was that stock data before 1900 was not valid (a fair point) and that the remaining number of cycles after 1900 (27) did not meet the standard for statistical significance that he quoted as 30 (really?).
And he ended the article there, dismissing any seasonality claim with no further discussion.
Before we dig further into the presidential cycle and its supporters, let’s look at the statistical argument. First, we’ll amend Twain’s quote (above) and add a fourth type of untruth : the inadvertently misspoken person who doesn’t understand statistics in the first place. And while trying not to bore everyone out there with a discussion on statistical significance, (if you’re looking for detailed mathematical descriptions of chi squared distributions, Google away…!) I’ll state that 30 is only a rule a thumb, not a statistical barrier or certainty (We’ll dig into that in a subsequent article). So categorically saying that a sample size of 27 gives garbage results while 30 would be just fine is either naïve, inflammatory, or both.
So to see just how good the presidential cycle concept is really as good, I did a very brief literature search and found a peer-reviewed paper that was published in the Journal of Portfolio Management by Beyer, Jenson and Johnson entitled “The Presidential Term: Is the Third Year the Charm ?”. Mr. Beyer, et al, apparently did their calculations properly and found statistical significance for the second half of presidential terms being stronger and the third year (in the current cycle the year 2023), in particular, being the strongest.
In addition to Hirsch and the journal paper mentioned above, the New York Times reported Ned Davis Research’s independently developed numbers for the presidential cycle as follows:
Year 1: 5.5% (post-election in the table above)
Year 2: 3.7% (mid-term)
Year 3: 12.6% (pre-election)
Year 4: 7.5% (pre-election)
As you can see, this supports Hirsch’s original thesis.
So, Does Anyone Use It?
Many of the traders and researchers I work with on a regular basis do, in fact, pay attention to presidential cycle.
My good friend and technical analysis guru Marc Chaikin spent a good bit of time on a major TV financial show discussing the cycle and its effectiveness. In the same New York Times article mentioned above, no less a trader and analyst that Jeremy Grantham says that he and many money managers “will make bets based on the current (presidential) cycle.”
This cycle has had my attention in years past and does again this year.
Great trading and God bless you,
D. R.
Don't fall prey to loss aversion
Design better portfolios with RiskSmith

Related Posts